Product Data & Online GIS
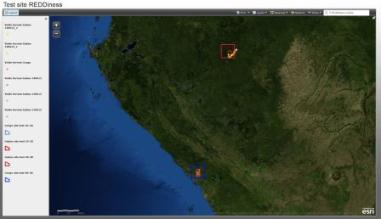
All products and analyzes are performed on the selected study sites in the Republic of Congo and Gabon. In each country, the study site covers an area of 40x40 km for the analysis of forest degradation from high resolution remote sensing data (optical and radar). Within each site, a more detailed analysis is performed on an area of 10x20 km with very high resolution and field data. The purpose of the field missions is double :
i) to strengthen local skills (use of GPS data, integration of data in a GIS ...)
ii) check and validate the analytical results obtained from optical and radar data.
The location of the field data collected are available via the picture below (to open with Fire Fox or Google Chrome).
Support Central Africa in Earth Observation driven forest monitoring for REDD
This project is partially funded by the European Commission Seventh Framework Programme. The project reflects only the author’s views and the Community is not liable for any use that may be made of the information contained herein.

PROJECT OUTCOMES
Three types of data were acquired to perform the analyses :
Three analyses were conducted to monitor the forest changes in terms of forest degradation : (consult our WP3 report for further information)
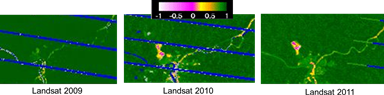
1. Optical High resolution - Detection of the intensity of degradation with NDFI analyse
The Normalized Difference Fraction Index (NDFI) is a method of spectral mixture analysis successfully applied in the Brazilian Amazon to identify and distinguish forest degradation caused by selective logging and forest fires associated with other natural disturbances. The potential of this technique was tested in both study countries.
- optical : Landsat, QuickBird and WorldView
- radar : ENVISAT ASAR, PALSAR, RADARSAT, TerraSAR-X
- field data: georeferenced pictures
Three analyses were conducted to monitor the forest changes in terms of forest degradation : (consult our WP3 report for further information)
1. Optical High resolution - Detection of the intensity of degradation with NDFI analyse
The Normalized Difference Fraction Index (NDFI) is a method of spectral mixture analysis successfully applied in the Brazilian Amazon to identify and distinguish forest degradation caused by selective logging and forest fires associated with other natural disturbances. The potential of this technique was tested in both study countries.
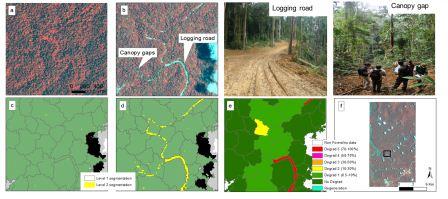
2. Optical Very high resolution - Degradation and forest changes detection
Based on very high resolution data, the object-based classification and multi-date segmentation techniques were tested to provide a system for monitoring small forest degradation features (< 1ha) and evaluating the rate of forest degradation. The figure c and d below show the two levels of segmentation created respectively for 2010 and 2012 to detect forest degradation. Level 1 objects (large objects) aggregate small degradation features information to highlight five level of forest degradation whereas smaller level 2 objects show the extent and the exact location of these small features. Figure e illustrates the level of forest degradation for each large object between 2010 and 2012.
Based on very high resolution data, the object-based classification and multi-date segmentation techniques were tested to provide a system for monitoring small forest degradation features (< 1ha) and evaluating the rate of forest degradation. The figure c and d below show the two levels of segmentation created respectively for 2010 and 2012 to detect forest degradation. Level 1 objects (large objects) aggregate small degradation features information to highlight five level of forest degradation whereas smaller level 2 objects show the extent and the exact location of these small features. Figure e illustrates the level of forest degradation for each large object between 2010 and 2012.
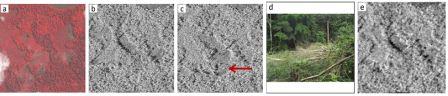
3. Radar - Mono and multi-temporal visual analysis
The main objective of this analysis is to assess the potential and limitations of radar data in detecting forest degradation. The first, tedious, step was the preprocessing of all images acquired. The principal component analysis is a visual comparison of radar images with evidence of degradation based on very high resolution images and field data. An example of such a comparison is shown in figure below.
The main objective of this analysis is to assess the potential and limitations of radar data in detecting forest degradation. The first, tedious, step was the preprocessing of all images acquired. The principal component analysis is a visual comparison of radar images with evidence of degradation based on very high resolution images and field data. An example of such a comparison is shown in figure below.